Hello!
Can you tell me how to find out the efficiency of acceptance and cross section of MC data? For example:
https://opendata.cern.ch/record/718
Thank you!
Hello!
Can you tell me how to find out the efficiency of acceptance and cross section of MC data? For example:
https://opendata.cern.ch/record/718
Thank you!
Hello,
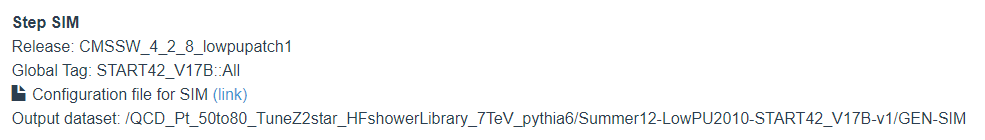
The Pythia information for this sample can be found in the configuration file for the SIM step: https://opendata.cern.ch/eos/opendata/cms/configuration-files/MonteCarlo2010/153fbc65b3d49ee64349d246f492f20f.configFile.py
(search “process.generator” to see the exact Pythia segment)
There is some filter and cross section information in that snippet. For more details I would try actually processing that configuration file with “cmsRun” in your docker container or VM.
Regards,
Julie Hogan
Thanks for the answer!
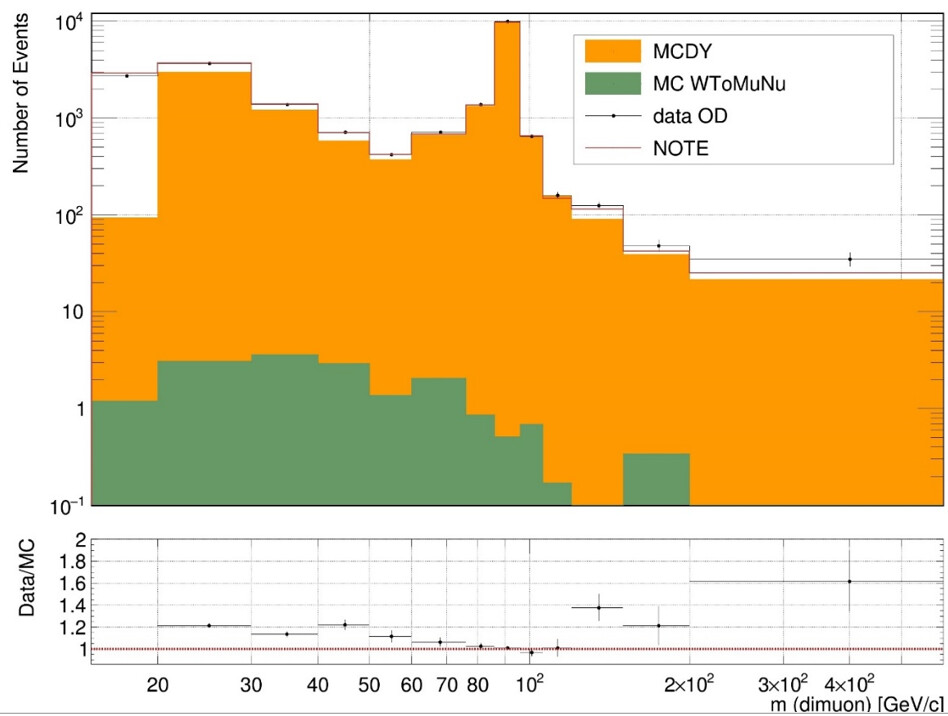
I have seen the cross-section values in this file. For MCDY, it is equal to 1300 pb. I tried to normalize it to data taking into account the MuonSelection from the note (CMS NOTE AN-11-013), but could not. I tried to take the values of 1666 pb from the note and got the Data/MC ratio in the area of the Z peak close to 1. Can I be sure of the values in the sim sheet?
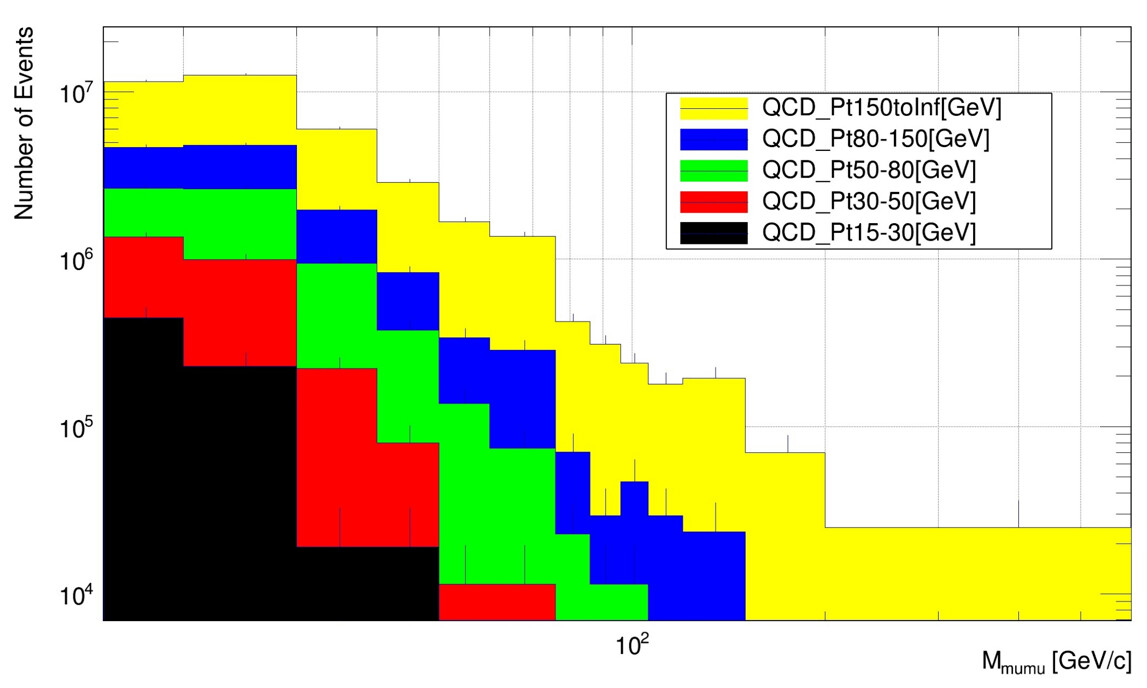
I also tried to get the distribution of events taking into account the identification of muons for QCD datasets. This were:
CMS_MonteCarlo2010_Summer12_QCD_Pt_15to30_TuneZ2star_HFshowerLibrary_7TeV_pythia6_AODSIM_LowPU2010_DR42_PU_S0_START42_V17B-v1
CMS_MonteCarlo2010_Summer12_QCD_Pt_30to50_TuneZ2star_HFshowerLibrary_7TeV_pythia6_AODSIM_LowPU2010_DR42_PU_S0_START42_V17 Bv 1
CMS_MonteCarlo2010_Summer12_QCD_Pt_50to80_TuneZ2star_HFshowerLibrary_7TeV_pythia6_AODSIM_LowPU2010_DR42_PU_S0_START42_V17B-v1
CMS_MonteCarlo2010_Summer12_QCD_Pt_80to150_fwdJet_TuneZ2star_HFshowerLibrary_7TeV_pythia6_AODSIM_LowPU2010_DR42-PU_S0_START42_V17B-v1
CMS_MonteCarlo2010_Summer12_QCD_Pt_150toInf_fwdJet_TuneZ2star_HFshowerLibrary_7TeV_pythia6_AODSIM_LowPU2010_DR42-PU_S0_START42_V17B-v1
In 3 data sets, the cross-section value is the same 815912800.0 pb. For Pt 30-50 and Pt 50-80 GeV is orders of magnitude less. When I tried to normalize their, the number of events from the Pt15-30 set was greater than in Pt30-50 and Pt 50-80. Should there be the same cross section for these sets, or am I doing the normalization wrong?
Below is the result with one cross section for all sets.
Hello,
I would use the cross sections from analysis documentation if you have access to it. Typically analysts will want to “upgrade” the leading-order cross sections to NLO or NNLO, which would come from other sources.
For QCD I would expect each of those samples to have either a different cross section or at least a different filter efficiency because a PT selection has been made. The effective cross sections should decrease with PT – an order-of-magnitude drop to each region is reasonable. If you can share their links I will try to take a look.
Julie
Hello!
Of course,
I am interested to know if it is possible to find out information about cross sections within the framework of open data?
Thank you!
Thanks – looking at these samples I don’t think the “crossSection” field in the Pythia settings is enough information. There should certainly be differences between each pT bin.
It’s very difficult to provide a “master table” of cross sections because of the wide variety of filters applied to different simulations, and because for many samples analyzers prefer to manually scale based on external cross section predictions or measurements.
Try downloading one of the configuration files for the SIM step and running it with the command “cmsRun”. I believe there will be a summary printout from the generator that might give more information about the leading-order cross section for these QCD samples
Julie